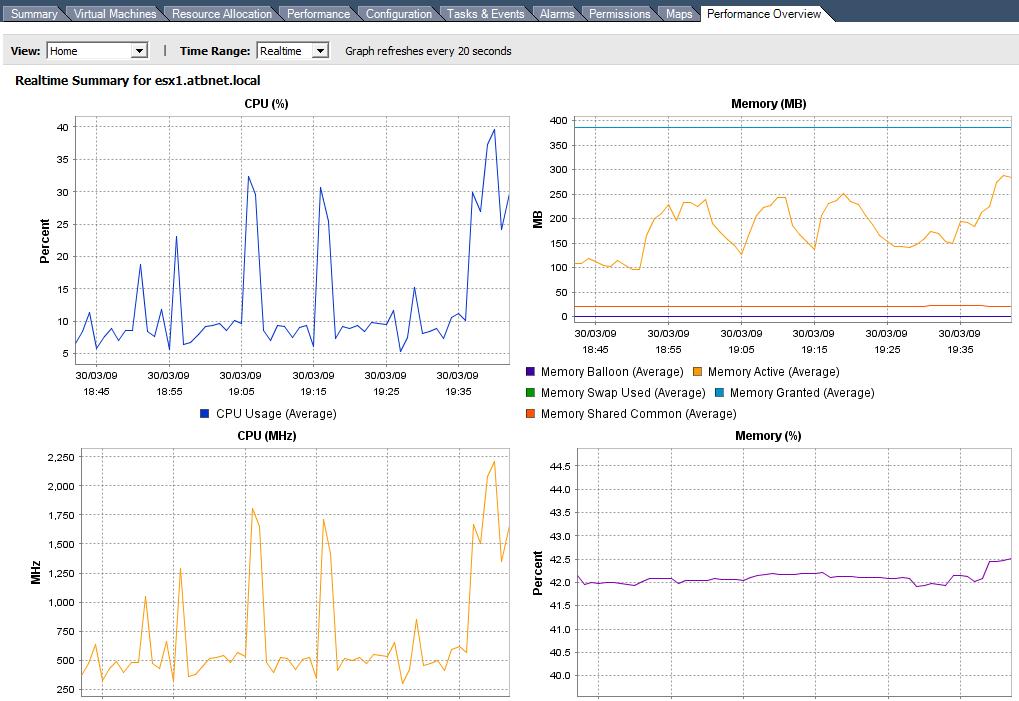
The Performance Overview charts plugin was introduced in vCenter 2.5 U4. It can be used to a better overview of the resource usage in a cluster, an ESX/ESXi Server and in a Virtual Machine. This however has to be installed manually, seperate from the actual upgrade or installation.
1. Download and install vCenter Server2.5 U4
Keep the iso / zip file on the vCenter server to install the performance charts.
2. Download and Install Java SE Development Kit 6U11
http://developers.sun.com/downloads/
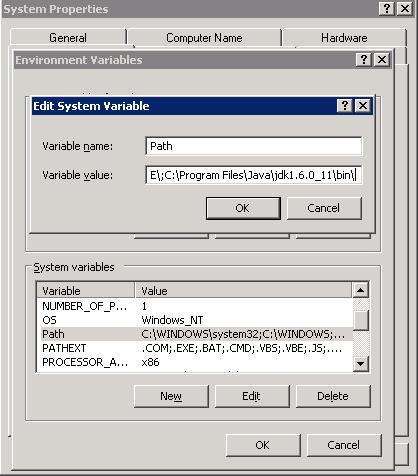
3. Modify PATH environment variable
Right click "My Computer" and select "Properties".
Click the "Advanced" tab and click "Environment Variables".
In the System variable list, select "Path" and click Edit.
Append ;C:\Program Files\Java\jdk1.6.0_11\bin\
Note: add a semicolon before the above line.
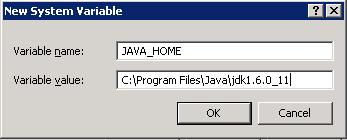
4. Add/Modify JAVA_HOME environment variable
Click "New" and set the variable name to "JAVA_HOME"
And the value to "C:\Program Files\Java\jdk1.6.0_11"
And the value to "C:\Program Files\Java\jdk1.6.0_11"
5. Logoff and Logon to the vCenter Server to ensure variables are correct
echo %PATH%
echo %JAVA_HOME%
6. Install the Performance Charts
Open a command prompt
cmd
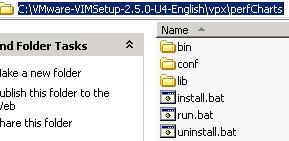
Go to the location of the installation media and go to the "vpx/peftCharts" folder
cd C:\VMware-VIMSetup-2.5.0-U4-English\vpx\perfCharts
installer.bat administrator Password1
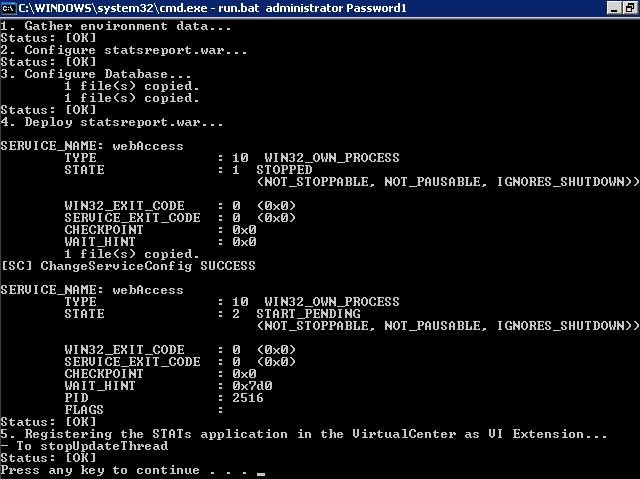
7. Check the Performance Overview charts are now working